
QuickGraph #6: COVID-19 Taxonomy Graph
It’s been several months since our last QuickGraph and the world feels very different than it was back then. I’ve been reading a couple of books about viruses - Spillover and Pale Rider - and am now very curious to learn more about the medical terms reference in the books.
With the Pre Release of neosemantics (n10s) for Neo4j 4.0, I thought it would be interesting to create a graph of the taxonomy of the virus that caused COVID-19, using data extracted from Wikidata’s SPARQL API.
Let’s get started!
Setting up Neo4j
We’re going to use the following Docker Compose configuration in this blog post:
version: '3.7'

services:
  neo4j:
    image: neo4j:4.0-enterprise
    container_name: "covid-graph"
    volumes:
      - ./plugins:/plugins
      - ./data-4.0:/data
      - ./import:/var/lib/neo4j/import
    ports:
      - "7474:7474"
      - "7687:7687"
    environment:
      - "NEO4J_ACCEPT_LICENSE_AGREEMENT=yes"
      - "NEO4J_AUTH=neo4j/neo"
      - NEO4J_apoc_import_file_enabled=true
      - NEO4J_apoc_export_file_enabled=true
      - NEO4J_dbms_directories_import=import
      - NEO4JLABS_PLUGINS=["apoc"]
We’ll manually copy the n10s jar into the plugins directory, and then run the following command:
docker-compose upIf everything’s working properly, we’ll see the following:
Starting covid-graph ... done
Attaching to covid-graph
covid-graph | Changed password for user 'neo4j'.
covid-graph | Fetching versions.json for Plugin 'apoc' from https://neo4j-contrib.github.io/neo4j-apoc-procedures/versions.json
covid-graph | Installing Plugin 'apoc' from https://github.com/neo4j-contrib/neo4j-apoc-procedures/releases/download/4.0.0.7/apoc-4.0.0.7-all.jar to /plugins/apoc.jar
covid-graph | Applying default values for plugin apoc to neo4j.conf
covid-graph | Directories in use:
covid-graph |   home:         /var/lib/neo4j
covid-graph |   config:       /var/lib/neo4j/conf
covid-graph |   logs:         /logs
covid-graph |   plugins:      /plugins
covid-graph |   import:       /var/lib/neo4j/import
covid-graph |   data:         /var/lib/neo4j/data
covid-graph |   certificates: /var/lib/neo4j/certificates
covid-graph |   run:          /var/lib/neo4j/run
covid-graph | Starting Neo4j.
covid-graph | 2020-04-20 19:56:48.326+0000 INFO  ======== Neo4j 4.0.3 ========
covid-graph | 2020-04-20 19:56:48.333+0000 INFO  Starting...
covid-graph | 2020-04-20 19:56:55.257+0000 INFO  Called db.clearQueryCaches(): Query cache already empty.
covid-graph | 2020-04-20 19:57:04.198+0000 INFO  Sending metrics to CSV file at /var/lib/neo4j/metrics
covid-graph | 2020-04-20 19:57:04.220+0000 INFO  Bolt enabled on 0.0.0.0:7687.
covid-graph | 2020-04-20 19:57:04.220+0000 INFO  Started.
covid-graph | 2020-04-20 19:57:04.370+0000 INFO  Server thread metrics have been registered successfully
covid-graph | 2020-04-20 19:57:05.324+0000 INFO  Remote interface available at http://0.0.0.0:7474/
Configuring n10s
Let’s now configure n10s so that it’s ready to import some data.
We need to create a unique constraint on :Resource(uri) and then call the n10s.graphconfig.init procedure to configure the library:
CREATE CONSTRAINT n10s_unique_uri ON (r:Resource)
ASSERT r.uri IS UNIQUE;

CALL n10s.graphconfig.init({handleVocabUris: "MAP"});
Virus Taxonomy
We’re now ready to start exploring Wikidata.
The virus behind COVID-19 is called SARS-CoV-2, so we’ll start there and then manually follow the parent taxon statement as far as we can.
This eventually leads us to Riboviria, which is described as follows:
Riboviria is a realm of viruses that encompasses all RNA viruses and viroids that replicate by means of RNA-dependent RNA polymerases.
Our manual traversal can also be expressed by the following SPARQL query:
CONSTRUCT {
  ?cat rdfs:label ?catName .
  ?subCat rdfs:label ?subCatName ;
          wdt:P171 ?parentCat .
  }
WHERE {
  ?cat rdfs:label "Riboviria"@en .
  ?cat rdfs:label ?catName .
  filter(lang(?catName) = "en") .
  ?subCat wdt:P171+ ?cat ;
          wdt:P171 ?parentCat;
          rdfs:label ?subCatName
          filter(lang(?subCatName) = "en") .
}
If we execute this query, we’ll see the following (truncated) output:
| subject | predicate | object |
|---|---|---|
Ebolavirus |
||
SARS-CoV-2 |
||
Middle East respiratory syndrome coronavirus |
||
Now let’s import this data into Neo4j so we can explore it further.
Constructing the Virus Taxonomy Graph
We’re going to import the data into the following Neo4j graph model:
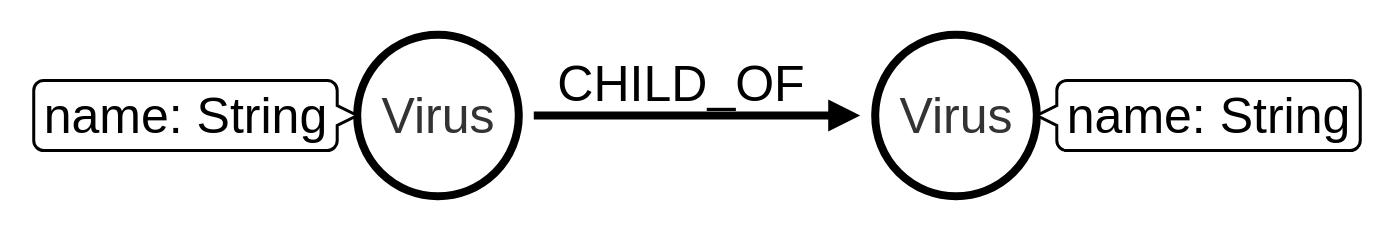
Our SPARQL query returns triples with the predicates http://www.wikidata.org/prop/direct/P171 and http://www.w3.org/2000/01/rdf-schema#label.
We’ll need to convert those to CHILD_OF and name respectively, which we can do by executing the following procedures:
CALL n10s.mapping.addSchema("http://www.wikidata.org/prop/direct/", "wdt");
CALL n10s.mapping.addMappingToSchema("http://www.wikidata.org/prop/direct/","CHILD_OF","P171");

CALL n10s.mapping.addSchema("http://www.w3.org/2000/01/rdf-schema#", "rdfs");
CALL n10s.mapping.addMappingToSchema("http://www.w3.org/2000/01/rdf-schema#","name","label");
We can now import the results of our SPARQL query into Neo4j using the n10s.rdf.import.fetch procedure:
WITH '
CONSTRUCT {
  ?cat rdfs:label ?catName .
  ?subCat rdfs:label ?subCatName ;
          wdt:P171 ?parentCat .
  }
WHERE {
  ?cat rdfs:label "Riboviria"@en .
  ?cat rdfs:label ?catName .
  filter(lang(?catName) = "en") .
  ?subCat wdt:P171+ ?cat ;
          wdt:P171 ?parentCat;
          rdfs:label ?subCatName
          filter(lang(?subCatName) = "en") .
}
' AS query
CALL n10s.rdf.import.fetch(
  "https://query.wikidata.org/sparql?query=" + apoc.text.urlencode(query),
  "JSON-LD",
  { headerParams: { Accept: "application/ld+json"}})
YIELD triplesLoaded
RETURN triplesLoaded;| triplesLoaded |
|---|
3259 |
Let’s now add the Virus label to each of our nodes:
MATCH (n:Resource)
SET n:Virus;
Before we continue, let’s do a bit of cleanup.
Wikidata’s taxonomy has some unnecessary shortcuts that make the graph harder to understand.
For example in the following visualisation we can remove a couple of extraneous CHILD_OF relationships:
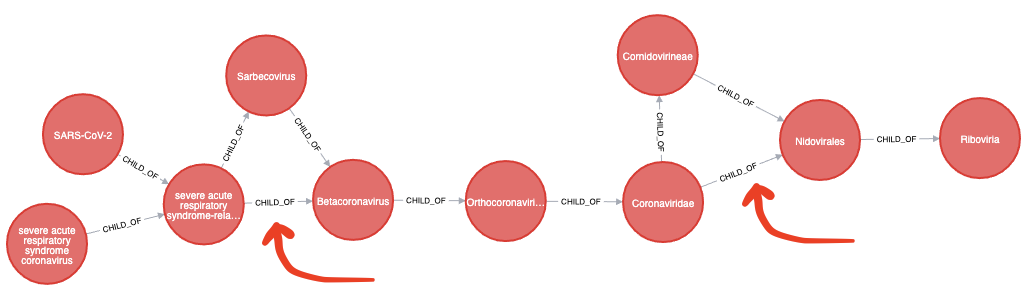
We can remove these shortcut relationships by running the following query:
MATCH (v:Virus)<-[co:CHILD_OF*2..]-(child)-[shortcut:CHILD_OF]->(v)
DELETE shortcut;
We’re now ready to query the graph.
Querying the Virus Taxonomy Graph
Let’s start with a query to find out the shortest path from the SARS virus to the SARS-CoV-2 virus:
MATCH (r1:Virus {name: "SARS-CoV-2"})
MATCH (r2:Virus {name: "severe acute respiratory syndrome coronavirus"})
MATCH path = shortestpath((r1)-[*]-(r2))
RETURN path;
If we run this query, we’ll see the Neo4j Browser visualisation below:

Both of these viruses have a common parent, severe acute respiratory syndrome-related coronavirus.
Where does the parent category fit in the whole taxonomy? We can find out by writing the following query:
MATCH (r1:Virus {name: "SARS-CoV-2"})
MATCH (r2:Virus {name: "severe acute respiratory syndrome coronavirus"})
MATCH path1 = (r1)-[:CHILD_OF*]->(r1root)
WHERE not((r1root)-[:CHILD_OF]->())
MATCH path2 = (r2)-[:CHILD_OF*]->(r2root)
WHERE not((r2root)-[:CHILD_OF]->())
RETURN path1, path2
And if we run this query, we’ll see the Neo4j Browser visualisation below:

Both of these coronaviruses are part of the Betacoronaviruses family, and from its Wikipedia page we learn that the virus that caused Middle East Respiratory Syndrome:
The Beta-CoVs of the greatest clinical importance concerning humans are OC43 and HKU1 of the A lineage, SARS-CoV and SARS-CoV-2 (which causes the disease COVID-19) of the B lineage, and MERS-CoV of the C lineage. MERS-CoV is the first betacoronavirus belonging to lineage C that is known to infect humans.
WITH ["SARS-CoV-2", "Middle East respiratory syndrome coronavirus", "severe acute respiratory syndrome coronavirus"] AS virus
UNWIND apoc.coll.combinations(virus, 2, 2) AS pair
MATCH (r1:Virus {name: pair[0]})
MATCH (r2:Virus {name: pair[1]})
MATCH path = shortestpath((r1)-[*]-(r2))
RETURN path
If we run this query, we’ll see the Neo4j Browser visualisation below:

MERS comes under Merbecovirus, which is described below:
Merbecovirus is a subgenus of viruses in the genus Betacoronavirus. The viruses in this subgenus were previously known as group 2c coronaviruses.
The viruses of this subgenus, like other coronaviruses, have a lipid bilayer envelope in which the membrane (M), envelope (E) and spike (S) structural proteins are anchored.
Now I’m curious about the other sub children of Betacoronavirus, which we can explore by writing the following query:
MATCH path = (virus:Virus {name: "Betacoronavirus"})<-[:CHILD_OF*]-(child)
RETURN path
The Neo4j Browser visualisation below shows the full taxonomy:

Enriching the graph
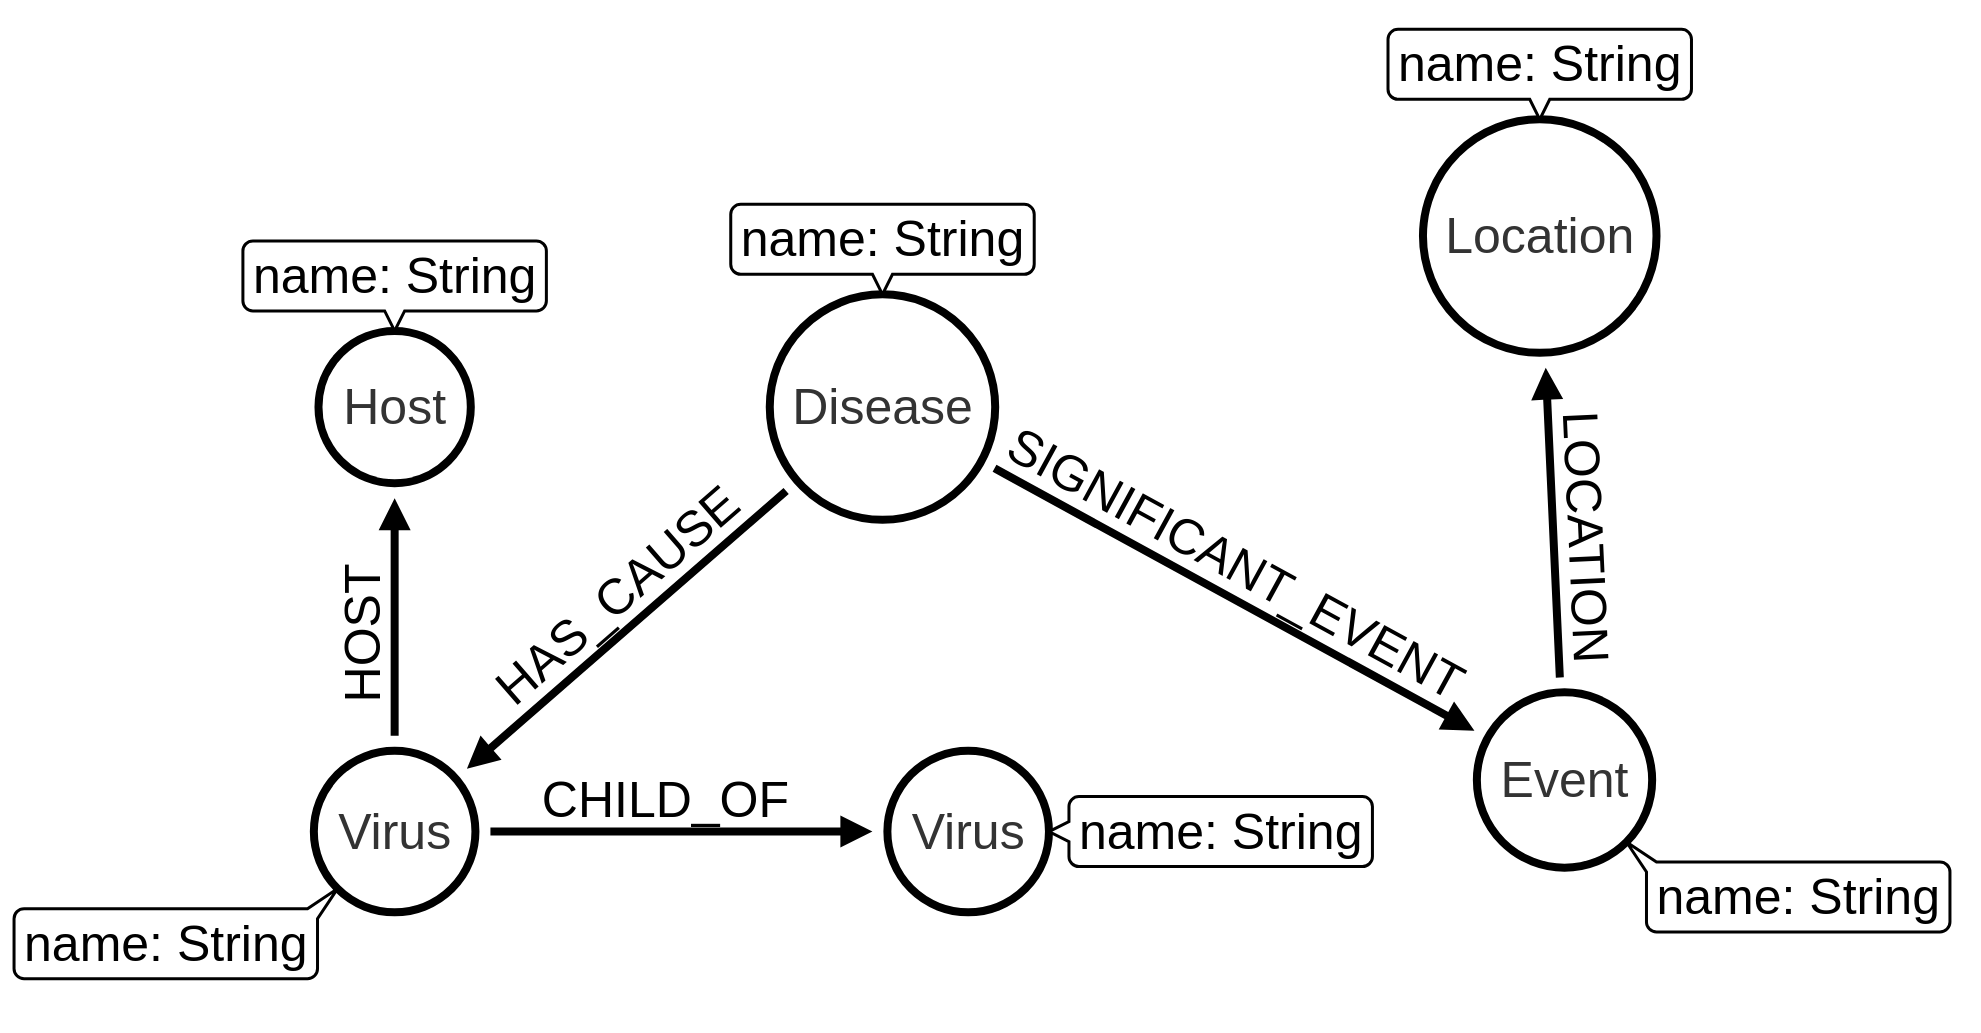
Now we’re going to add some more data to our graph. It’d be good to know which hosts each virus can infect, the diseases caused by these viruses, events associated with each disease, and the locations affected.
We’re eventually going to have the following graph model:
Let’s start by adding the hosts.
In Wikidata, the host statement is P2975, so we’ll need to create an n10s mapping to translate this to the HOST relationship type:
CALL n10s.mapping.addMappingToSchema("http://www.wikidata.org/prop/direct/","HOST","P2975");We can then write the following query to import the hosts for each virus:
MATCH (r:Virus)
WITH n10s.rdf.getIRILocalName(r.uri) AS virus, r
WITH 'prefix schema: <http://schema.org/>

CONSTRUCT {
  wd:' + virus + ' wdt:P2975 ?host.
  ?host rdfs:label ?hostName ;
        rdf:type schema:Host

}
WHERE {
  OPTIONAL {
    wd:' + virus + ' wdt:P2975 ?host.
    ?host rdfs:label ?hostName.
    filter(lang(?hostName) = "en")
  }
}' AS query, r
CALL n10s.rdf.import.fetch("https://query.wikidata.org/sparql?query=" + apoc.text.urlencode(query),
        "JSON-LD",
        { headerParams: { Accept: "application/ld+json"}})

YIELD triplesLoaded
RETURN r.name, triplesLoaded;
Now we’re going to add the diseases, events, and locations. We have a few more Wikidata to n10s mappings to do:
-
has cause (P828) →
HAS_CAUSE -
instance of (P31) →
INSTANCE_OF -
location (P276) →
LOCATION -
significant event (P793) →
SIGNIFICANT_EVENT
We can create these mappings by making the following procedure calls:
CALL n10s.mapping.addMappingToSchema("http://www.wikidata.org/prop/direct/","HAS_CAUSE","P828");
CALL n10s.mapping.addMappingToSchema("http://www.wikidata.org/prop/direct/","INSTANCE_OF","P31");
CALL n10s.mapping.addMappingToSchema("http://www.wikidata.org/prop/direct/","LOCATION","P276");
CALL n10s.mapping.addMappingToSchema("http://www.wikidata.org/prop/direct/","SIGNIFICANT_EVENT","P793");
Now we’re ready to import the data, which we can do by running the following query:
MATCH (r:Virus)
WITH n10s.rdf.getIRILocalName(r.uri) AS virus, r
WITH 'prefix schema: <http://schema.org/>

CONSTRUCT {
  ?event wdt:P828 wd:' + virus + ';
         wdt:P31 ?eventType;
         rdfs:label ?diseaseName;
         wdt:P276 ?origin ;
         wdt:P793 ?significantEvent.
  ?origin rdfs:label ?originName;
          rdf:type schema:Place .
  ?eventType rdfs:label ?eventTypeName.
  ?significantEvent rdfs:label ?significantEventName ;
                    rdf:type schema:Event.
}
WHERE {
  { ?event wdt:P828 wd:'+ virus + '; }
  UNION
  { ?event wdt:P1478 wd:' + virus + '; } .
  ?event rdfs:label ?diseaseName .
  filter(lang(?diseaseName) = "en")

  OPTIONAL { ?event wdt:P31 ?eventType.
           ?eventType rdfs:label ?eventTypeName
               filter(lang(?eventTypeName) = "en")}

  OPTIONAL {
    ?event wdt:P276 ?origin .
    ?origin rdfs:label ?originName .
    filter(lang(?originName) = "en")
  }

  OPTIONAL {
    ?event wdt:P793 ?significantEvent .
           ?significantEvent rdfs:label ?significantEventName .
    filter(lang(?significantEventName) = "en")
    }
}' AS query, r
CALL n10s.rdf.import.fetch("https://query.wikidata.org/sparql?query=" + apoc.text.urlencode(query),
        "JSON-LD",
        { headerParams: { Accept: "application/ld+json"}})

YIELD triplesLoaded
RETURN r.name, triplesLoaded
ORDER BY triplesLoaded DESC;
Once this has finished, we’ll run the following query to add the Disease label to any nodes that have an INSTANCE of relationship to a node that represents an infectious disease:
MATCH (r:Resource)-[:INSTANCE_OF]->(item:Resource)
WHERE item.name CONTAINS "infectious disease"
WITH r, collect(item.name) AS items
SET r:Disease;
Querying the Enriched Graph
Now that we’ve got that data loaded, let’s start by finding the viruses that affect humans:
MATCH hostPath = (h:Host {name: "Homo sapiens"})<-[:HOST]-(virus)-[:HOST]->(otherHost)
RETURN hostPath
We get back the three viruses that we’ve explored so far: SARS, SARS-CoV-2, and MERS. SARS and SARS-CoV-2 also affect bats, and MERS affects camels.
Let’s extend our query to return viruses and diseases as well:
MATCH hostPath = (h:Host {name: "Homo sapiens"})<-[:HOST]-(virus)-[:HOST]->(otherHost)
OPTIONAL MATCH diseasePath = (virus)<-[:CHILD_OF*0..]-(v)<-[:HAS_CAUSE]-(thing)
OPTIONAL MATCH eventPath = (thing)-[:LOCATION|:SIGNIFICANT_EVENT]->(event)
RETURN hostPath, diseasePath, eventPath
If we run this query, we’ll see the Neo4j Browser visualisation below:

We can now see nodes representing the pandemics in different countries for COVID-19. There’s also one node representing the SARS outbreak in 2002, and 3 nodes for the MERS outbreaks in 2012, 2015, and 2018.
What’s interesting about this QuickGraph?
This QuickGraph has gone on for much longer than I expected, so it’s time to wrap up. What makes this QuickGraph interesting to me is that the dataset is perfect for writing variable path queries.
It also gave me an opportunity to use n10s for the first time, which was a good experience. I have to say thanks to Jesus for all his help with the queries in this post.
And finally, if you want to build this graph yourself, the code is available in the mneedham/covid-graph GitHub repository.
About the author
I'm currently working on short form content at ClickHouse. I publish short 5 minute videos showing how to solve data problems on YouTube @LearnDataWithMark. I previously worked on graph analytics at Neo4j, where I also co-authored the O'Reilly Graph Algorithms Book with Amy Hodler.