
Python: Altair - TypeError: Object of type date is not JSON serializable
I’ve been playing with the Altair statistical visualisation library and recently ran into an error while trying to render a DataFrame that contained dates.
I was trying to render a scatterplot containing the chart position of a song on a certain date, as seen in the code below:
# pip install altair pandas

import altair as alt
import pandas as pd
import datetime

df = pd.DataFrame( [
    {"position": 2, "date": datetime.date(2019,1,3)},
    {"position": 77, "date": datetime.date(2019,11,21)},
    {"position": 59, "date": datetime.date(2019,11,28)},
    {"position": 34, "date": datetime.date(2019,12,5)},
    {"position": 8, "date": datetime.date(2019,12,12)},
    {"position": 6, "date": datetime.date(2019,12,19)},
    {"position": 8, "date": datetime.date(2019,12,26)},
])


chart = alt.Chart(df).mark_point(color="red").encode(x='date', y='position')
chart.save("chart.html")
If we run this script, we’ll see the following error message:
Traceback (most recent call last):
  File "scripts/blog.py", line 22, in <module>
    chart.save("chart.html")
  File "/home/markhneedham/.local/share/virtualenvs/uk-charts-gqTVV0T1/lib/python3.7/site-packages/altair/vegalite/v4/api.py", line 447, in save
    result = save(**kwds)
  File "/home/markhneedham/.local/share/virtualenvs/uk-charts-gqTVV0T1/lib/python3.7/site-packages/altair/utils/save.py", line 68, in save
    spec = chart.to_dict()
  File "/home/markhneedham/.local/share/virtualenvs/uk-charts-gqTVV0T1/lib/python3.7/site-packages/altair/vegalite/v4/api.py", line 355, in to_dict
    copy.data = _prepare_data(original_data, context)
  File "/home/markhneedham/.local/share/virtualenvs/uk-charts-gqTVV0T1/lib/python3.7/site-packages/altair/vegalite/v4/api.py", line 92, in _prepare_data
    data = _consolidate_data(data, context)
  File "/home/markhneedham/.local/share/virtualenvs/uk-charts-gqTVV0T1/lib/python3.7/site-packages/altair/vegalite/v4/api.py", line 59, in _consolidate_data
    name = _dataset_name(values)
  File "/home/markhneedham/.local/share/virtualenvs/uk-charts-gqTVV0T1/lib/python3.7/site-packages/altair/vegalite/v4/api.py", line 35, in _dataset_name
    values_json = json.dumps(values, sort_keys=True)
  File "/home/markhneedham/anaconda3/lib/python3.7/json/__init__.py", line 238, in dumps
    **kw).encode(obj)
  File "/home/markhneedham/anaconda3/lib/python3.7/json/encoder.py", line 199, in encode
    chunks = self.iterencode(o, _one_shot=True)
  File "/home/markhneedham/anaconda3/lib/python3.7/json/encoder.py", line 257, in iterencode
    return _iterencode(o, 0)
  File "/home/markhneedham/anaconda3/lib/python3.7/json/encoder.py", line 179, in default
    raise TypeError(f'Object of type {o.__class__.__name__} '
TypeError: Object of type date is not JSON serializable
On a GitHub issue for a similar problem, Jake Vanderplas suggested that the issue might be that the column type was object. We can check this by calling the following function on our DataFrame:
print(df.dtypes)We can see the output of executing this function below:
position     int64
date        object
dtype: object
As Jake predicted, our date column has the type object, despite only containing dates.
We can fix that by coercing that column to the type datetime using the pd.to_datetime function:
df["date"] = pd.to_datetime(df["date"])If we output the types of our DataFrame now, we’ll see the following output:
position             int64
date        datetime64[ns]
dtype: object
We now have the following script:
df = pd.DataFrame( [
{"position": 2, "date": datetime.date(2019,1,3)},
{"position": 77, "date": datetime.date(2019,11,21)},
{"position": 59, "date": datetime.date(2019,11,28)},
{"position": 34, "date": datetime.date(2019,12,5)},
{"position": 8, "date": datetime.date(2019,12,12)},
{"position": 6, "date": datetime.date(2019,12,19)},
{"position": 8, "date": datetime.date(2019,12,26)},
])
df["date"] = pd.to_datetime(df["date"])
chart = alt.Chart(df).mark_point(color="red").encode(
x='date',
y='position')
print(df.dtypes)
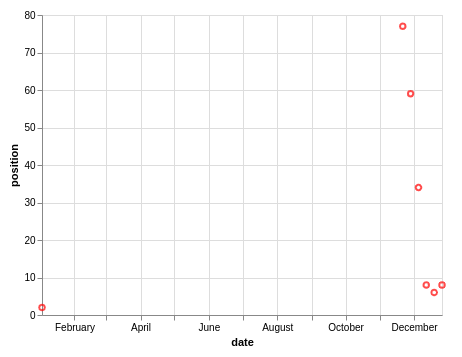
chart.save("chart.html")And if we run that script, we’ll have the following chart in the file chart.html:
About the author
I'm currently working on short form content at ClickHouse. I publish short 5 minute videos showing how to solve data problems on YouTube @LearnDataWithMark. I previously worked on graph analytics at Neo4j, where I also co-authored the O'Reilly Graph Algorithms Book with Amy Hodler.