
QuickGraph #4: UK Official Singles Chart 2019
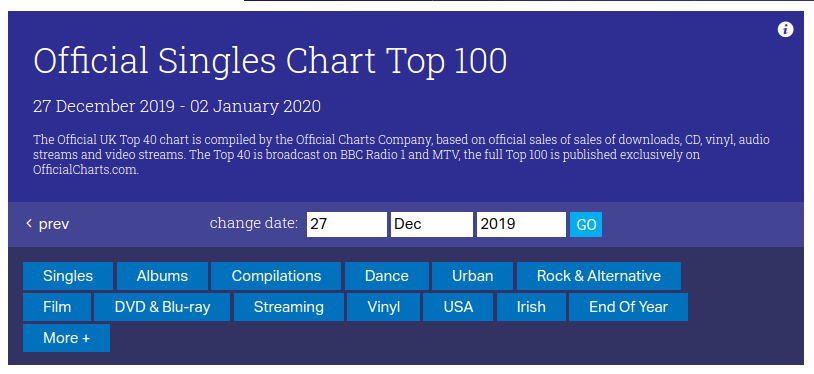
For our first QuickGraph of the new decade we’re going to explore data from the Official UK Top 40 Chart. This chart ranks the top 100 songs of the week based on official sales of sales of downloads, CD, vinyl, audio streams and video streams. Every week BBC Radio 1 broadcast the top 40 songs, which explains the name of the chart.
Scraping the Official Charts
I couldn’t find a dump of the dataset, so we’re going to use our web scraping skills again. Below is a printscreen showing the page that we’re going to scrape.
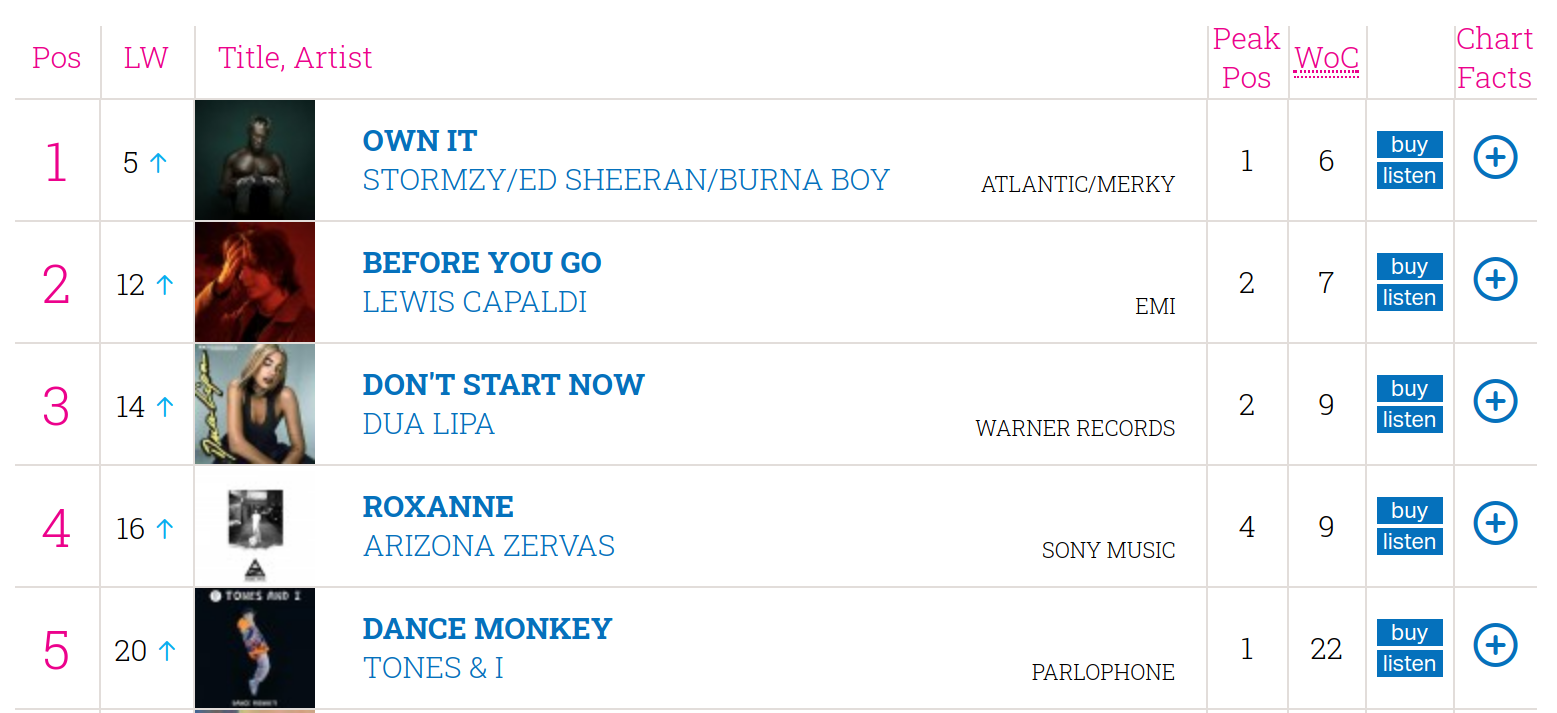
If we take a look at the underlying HTML, we’ll see that each chart entry is conveniently represented by a row in a table:
I wrote a couple of Python scripts to download each of the charts and then for each chart entry, extract the position, track, artist, and record label. We generate one JSON document per chart entry, and below is an example of one of these documents:
{
  "start": "01 March 2019",
  "end": "07 March 2019",
  "position": 2,
  "track_name": "Giant",
  "track_uri": "/search/singles/giant/",
  "track_file_name": "search-singles-giant",
  "artist_name": "Calvin Harris & Rag'N'Bone Man",
  "artist_uri": "/artist/54916/calvin-harris-and-ragnbone-man/",
  "label": "Columbia"
}
For many of the tracks the data scraped from the Official Charts website is sufficient, but for some of them I found it difficult to figure out the names of all the collaborating artists. I thought this would be a good opportunity to use the Spotify API to enrich the dataset.
Enriching the data with the Spotify API
We’ll use Spotify’s Search API to retrieve the names of all collaborating artists for a track. Instructions explaining how how to download and enrich the data are described in the uk-charts-neo4j repository.
Exploring the data
Let’s have a quick look at the first few lines of this file using command line tools:
head -n3 import/items.json | jq '.'If we run that command, we’ll see the following output:
{
  "start": "01 March 2019",
  "end": "07 March 2019",
  "position": 1,
  "track_name": "Someone You Loved",
  "track_uri": "/search/singles/someone-you-loved/",
  "track_file_name": "search-singles-someone-you-loved",
  "artist_name": "Lewis Capaldi",
  "artist_uri": "/artist/51369/lewis-capaldi/",
  "label": "Emi",
  "duration": 182160,
  "artists": [
    {
      "id": "4GNC7GD6oZMSxPGyXy4MNB",
      "name": "Lewis Capaldi"
    }
  ]
}
{
  "start": "01 March 2019",
  "end": "07 March 2019",
  "position": 2,
  "track_name": "Giant",
  "track_uri": "/search/singles/giant/",
  "track_file_name": "search-singles-giant",
  "artist_name": "Calvin Harris & Rag'N'Bone Man",
  "artist_uri": "/artist/54916/calvin-harris-and-ragnbone-man/",
  "label": "Columbia",
  "duration": 229184,
  "artists": [
    {
      "id": "7CajNmpbOovFoOoasH2HaY",
      "name": "Calvin Harris"
    },
    {
      "id": "4f9iBmdUOhQWeP7dcAn1pf",
      "name": "Rag'n'Bone Man"
    }
  ]
}
{
  "start": "01 March 2019",
  "end": "07 March 2019",
  "position": 3,
  "track_name": "Break Up With Your Girlfriend I'M Bored",
  "track_uri": "/search/singles/break-up-with-your-girlfriend-i'm-bored/",
  "track_file_name": "search-singles-break-up-with-your-girlfriend-i'm-bored",
  "artist_name": "Ariana Grande",
  "artist_uri": "/artist/26221/ariana-grande/",
  "label": "Republic Records",
  "duration": 190440,
  "artists": [
    {
      "id": "66CXWjxzNUsdJxJ2JdwvnR",
      "name": "Ariana Grande"
    }
  ]
}
We can also use the APOC Library’s apoc.load.json procedure to explore the data.
The following query returns the 1st chart entry:
CALL apoc.load.json("https://github.com/mneedham/uk-charts-neo4j/raw/master/import/items.json")
YIELD value
RETURN value
LIMIT 1
If we run that query we’ll see the following output:
| value |
|---|
{"duration":182160,"track_file_name":"search-singles-someone-you-loved","artist_uri":"/artist/51369/lewis-capaldi/","artist_name":"Lewis Capaldi","artists":[{"name":"Lewis Capaldi","id":"4GNC7GD6oZMSxPGyXy4MNB"}],"start":"01 March 2019","end":"07 March 2019","position":1,"label":"Emi","track_uri":"/search/singles/someone-you-loved/","track_name":"Someone You Loved"} |
Next we’re going to use the apoc.load.json procedure to load the data into Neo4j.
Importing the data
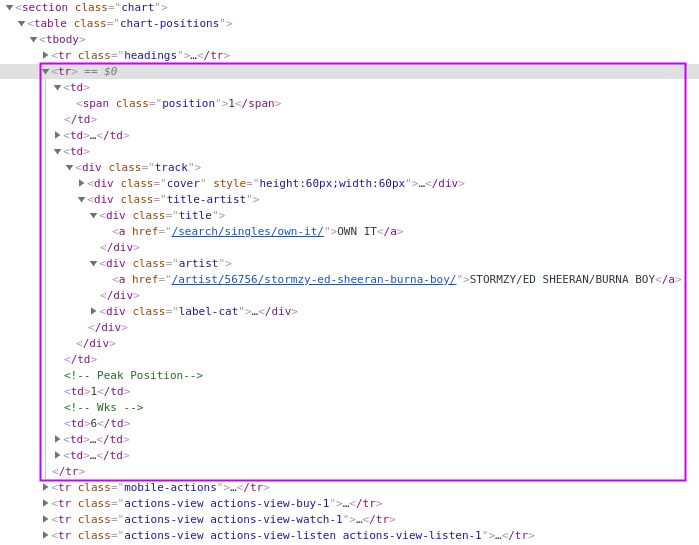
We’re going to import the data into the following graph model:
The following statements set up indexes and constraints for our graph:
CREATE INDEX ON :Chart(start);
CREATE CONSTRAINT ON (l:Label) ASSERT l.name IS UNIQUE;
CREATE CONSTRAINT ON (s:Song) ASSERT s.uri IS UNIQUE;
CREATE CONSTRAINT ON (a:Artist) ASSERT a.id IS UNIQUE;
The following statement imports the charts, songs, artists, and labels into the graph:
CALL apoc.load.json("file://items.json")
YIELD value
MERGE (chart:Chart {
start: date(datetime({epochmillis: apoc.date.parse(value.start, "ms", "dd MMMM yyyy")})),
end: date(datetime({epochmillis: apoc.date.parse(value.end, "ms", "dd MMMM yyyy")}))
})
MERGE (label:Label {name: value.label})
MERGE (song:Song {uri: value.track_uri})
SET song.title = value.track_name,
song.duration = CASE WHEN value.duration is null THEN null
ELSE duration({milliseconds:value.duration})
END
MERGE (song)-[:LABEL]->(label)
MERGE (song)-[inChart:IN_CHART]->(chart)
SET inChart.position = value.position
FOREACH(artist IN value.artists |
MERGE (a:Artist {id: artist.id})
SET a.name = artist.name
MERGE (song)-[:ARTIST]->(a)
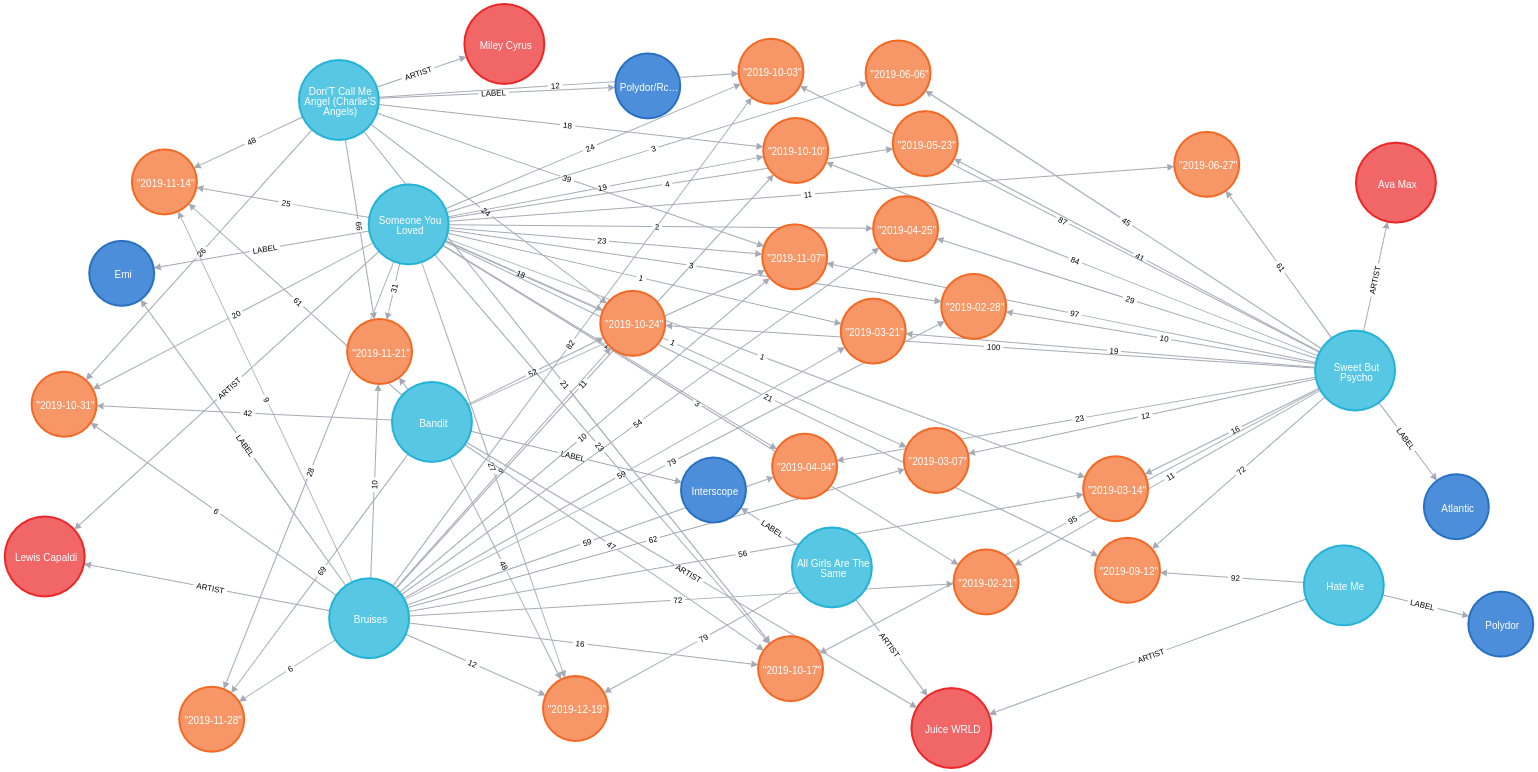
);We can see a sample of the imported graph in the Neo4j Browser visualisation below:
Querying the graph
Now let’s explore the data using Neo4j’s Cypher query language.
Which song was number 1 for the most weeks?
MATCH (song:Song)-[inChart:IN_CHART {position: 1}]->(chart),
      (song)-[:ARTIST]->(artist)

// order the chart dates so that they show in order when
// we collect them in the RETURN statement
WITH song, collect(artist.name) AS artists, inChart, chart
ORDER BY chart.start

RETURN song.title AS song, artists,
       apoc.date.format(song.duration.milliseconds, 'ms', 'mm:ss') AS duration,
       count(*) AS count, collect(toString(chart.end)) AS weeks
ORDER By count DESC;| song | artists | duration | count | weeks |
|---|---|---|---|---|
"Dance Monkey" |
["Tones and I"] |
"03:29" |
11 |
["2019-10-10", "2019-10-17", "2019-10-24", "2019-10-31", "2019-11-07", "2019-11-14", "2019-11-21", "2019-11-28", "2019-12-05", "2019-12-12", "2019-12-19"] |
"I Don’T Care" |
["Ed Sheeran", "Justin Bieber"] |
"03:39" |
8 |
["2019-05-23", "2019-05-30", "2019-06-06", "2019-06-13", "2019-06-20", "2019-06-27", "2019-07-04", "2019-07-11"] |
"Someone You Loved" |
["Lewis Capaldi"] |
"03:02" |
7 |
["2019-03-07", "2019-03-14", "2019-03-21", "2019-03-28", "2019-04-04", "2019-04-11", "2019-04-18"] |
"Senorita" |
["Shawn Mendes", "Camila Cabello"] |
"03:10" |
6 |
["2019-07-18", "2019-08-01", "2019-08-08", "2019-08-15", "2019-08-22", "2019-08-29"] |
"Take Me Back To London" |
["Ed Sheeran", "Stormzy"] |
"03:09" |
5 |
["2019-09-05", "2019-09-12", "2019-09-19", "2019-09-26", "2019-10-03"] |
"Sweet But Psycho" |
["Ava Max"] |
"03:07" |
4 |
["2019-01-03", "2019-01-10", "2019-01-17", "2019-01-24"] |
"7 Rings" |
["Ariana Grande"] |
"02:58" |
4 |
["2019-01-31", "2019-02-07", "2019-02-14", "2019-02-28"] |
"Old Town Road" |
["Billy Ray Cyrus", "Lil Nas X"] |
"02:37" |
2 |
["2019-04-25", "2019-05-02"] |
"Vossi Bop" |
["Stormzy"] |
"03:16" |
2 |
["2019-05-09", "2019-05-16"] |
"Break Up With Your Girlfriend I’M Bored" |
["Ariana Grande"] |
"03:10" |
1 |
["2019-02-21"] |
"Beautiful People" |
["Khalid", "Ed Sheeran"] |
"03:17" |
1 |
["2019-07-25"] |
"I Love Sausage Rolls" |
["LadBaby"] |
"03:23" |
1 |
["2019-12-26"] |
The extremely catchy Dance Monkey was number 1 for 11 weeks, or just less than 3 months of the year. We can see Ed Sheeran show up in the artists column a few times as well, so let’s next see which artist was number 1 for the most weeks.
Which artist was number 1 for the most weeks?
MATCH (song:Song)-[inChart:IN_CHART {position: 1}]->(chart),
      (song)-[:ARTIST]->(artist:Artist)
WITH artist, song, count(*) AS weeks
RETURN artist.name,
       apoc.map.fromPairs(collect([song.title, weeks])) AS songs,
       count(*) AS count,
       sum(weeks) AS weeks
ORDER BY weeks DESC;| artist | songs | count | weeks |
|---|---|---|---|
"Ed Sheeran" |
{ |
3 |
14 |
"Tones and I" |
{ |
1 |
11 |
"Justin Bieber" |
{ |
1 |
8 |
"Lewis Capaldi" |
{ |
1 |
7 |
"Stormzy" |
{ |
2 |
7 |
"Shawn Mendes" |
{Senorita: 6} |
1 |
6 |
"Camila Cabello" |
{Senorita: 6} |
1 |
6 |
"Ariana Grande" |
{ |
2 |
5 |
"Ava Max" |
{ |
1 |
4 |
"Billy Ray Cyrus" |
{ |
1 |
2 |
"Lil Nas X" |
{ |
1 |
2 |
"Khalid" |
{ |
1 |
1 |
"LadBaby" |
{ |
1 |
1 |
Ed Sheeran had 3 number 1’s last year, giving him a total of 14 weeks at number 1. I was surprised not to see what I thought was his most popular song of the year, South Of The Border. Let’s see what happened there.
How did South Of The Border do on the charts?
MATCH (song:Song {title: "South Of The Border"})
MATCH (song)-[inChart:IN_CHART]->(chart)

WITH song, chart, inChart ORDER BY chart.start

RETURN inChart.position AS position,
       collect(toString(chart.end)) AS charts
ORDER BY position| position | charts |
|---|---|
4 |
["2019-10-31", "2019-11-14", "2019-11-21"] |
5 |
["2019-11-07"] |
7 |
["2019-10-24", "2019-11-28"] |
9 |
["2019-12-05", "2019-12-12"] |
13 |
["2019-12-19"] |
24 |
["2019-10-17"] |
40 |
["2019-10-10"] |
55 |
["2019-12-26"] |
Hmmm, it peaked at number 4 back in October and November, before falling down the chart after that. I wonder if Ed Sheeran released any other songs last year?
How did Ed Sheeran’s other songs do?
MATCH (artist:Artist {name: "Ed Sheeran"})
MATCH (artist)<-[:ARTIST]-(song)-[inChart:IN_CHART]->(chart)

WITH song, artist,
     min(inChart.position) AS bestPosition,
     toString(min(chart.end)) AS chart
OPTIONAL MATCH (artist)<-[:ARTIST]-(song)-[:ARTIST]->(collaborator)

RETURN song.title AS song,
       collect(collaborator.name) AS collaborators,
       bestPosition, chart
ORDER BY bestPosition| song | collaborators | bestPosition | chart |
|---|---|---|---|
"I Don’T Care" |
["Justin Bieber"] |
1 |
"2019-05-23" |
"Take Me Back To London" |
["Stormzy"] |
1 |
"2019-07-25" |
"Beautiful People" |
["Khalid"] |
1 |
"2019-07-11" |
"Own It" |
["Burna Boy", "Stormzy"] |
2 |
"2019-12-05" |
"South Of The Border" |
["Camila Cabello", "Cardi B"] |
4 |
"2019-10-10" |
"Cross Me" |
["Chance the Rapper", "PnB Rock"] |
4 |
"2019-06-06" |
"Perfect" |
[] |
40 |
"2019-01-10" |
"Shape Of You" |
[] |
82 |
"2019-01-10" |
The last two on this list are hangovers from 2018. I expect they charted much higher during that year.
We can create a visual representation of this data by tweaking our query slightly:
MATCH (artist:Artist {name: "Ed Sheeran"})
MATCH (artist)<-[:ARTIST]-(song)-[inChart:IN_CHART]->(chart)

WITH song, artist,
     min(inChart.position) AS bestPosition,
     toString(min(chart.end)) AS chart

// Create virtual nodes and relationships to represent
// the best chart position for a song
CALL apoc.create.vNode(["Chart"], {end: chart}) YIELD node AS bestChart
CALL apoc.create.vRelationship(song, "IN_CHART", {position: bestPosition}, bestChart) YIELD rel

OPTIONAL MATCH (artist)<-[:ARTIST]-(song)-[:ARTIST]->(collaborator)
RETURN *
We could probably achieve the same result by tweaking the first part of the query, but I never like to miss an opportunity to use virtual nodes and relationships.
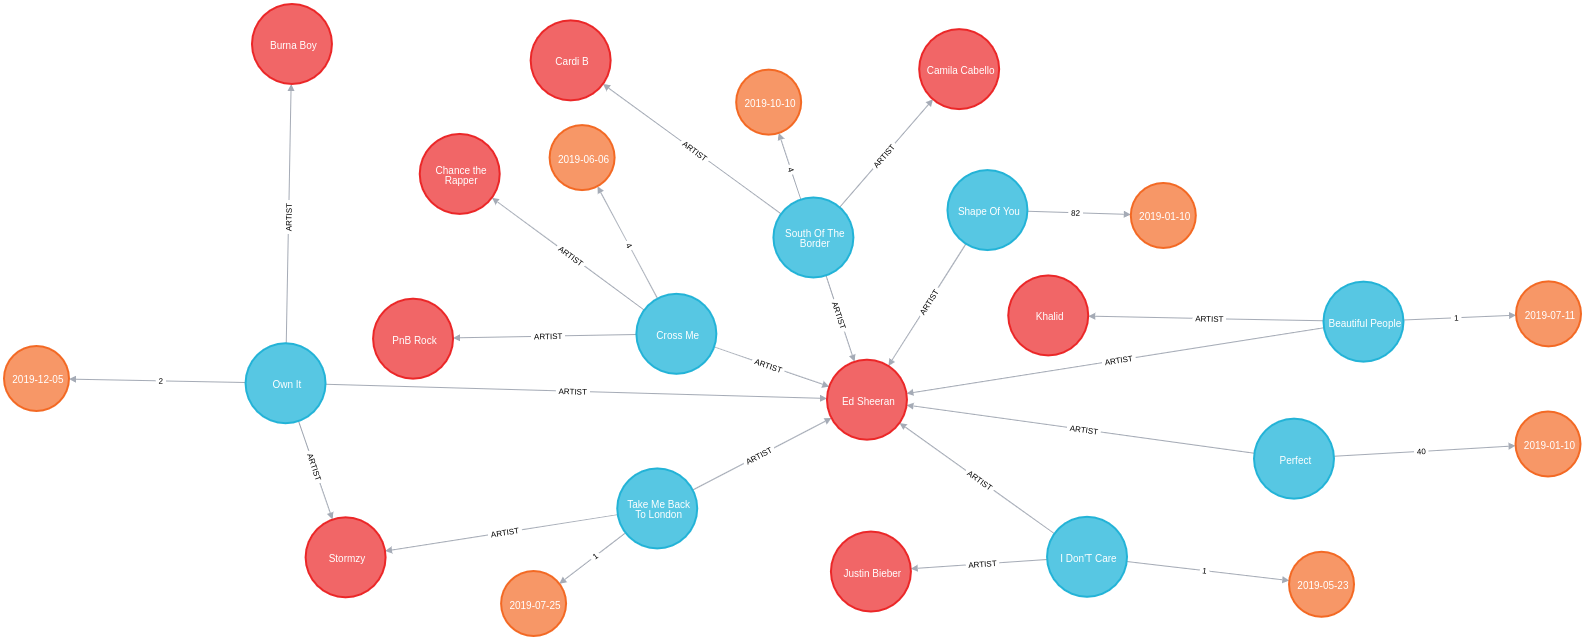
It’s interesting that he’s had a collaborator on all his other songs in 2019, and all of his songs charted in the top 5. Let’s explore artist collaborations a bit more.
How many collaborators did artists have during the year?
The following query computes the number of collaborators each artist had and then creates a histogram of those counts:
MATCH (artist:Artist)
OPTIONAL MATCH (artist)<-[:ARTIST]-(song)-[:ARTIST]->(otherArtist)
WITH artist, count(otherArtist) AS count
RETURN count, count(*)
ORDER BY count
This data is easiest to interpret as a chart, which we can create using chartgo.com.
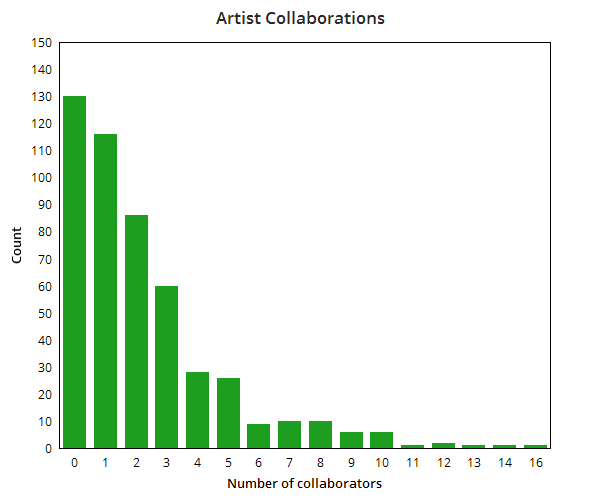
Although the majority of artists mostly worked alone or had only one collaborator, there are a reasonable number who had 6 or more collaborators over the year.
In all the queries that we’re written so far, we’ve been looking at the chart position for a song in a single week. We haven’t written any queries that look at how a song’s chart position changes over the weeks. What if we want to do this?
Which song had the biggest climb between weeks?
We’re going to work out which song had the biggest climb between weeks, but first we’ll create relationships between consecutive charts to make it easier to write this query.
So for example we’ll create a NEXT relationship between:
-
The Chart nodes with end properties
2019-02-14and2019-02-21 -
The Chart nodes with end properties
2019-02-21and2019-02-28
And so on.
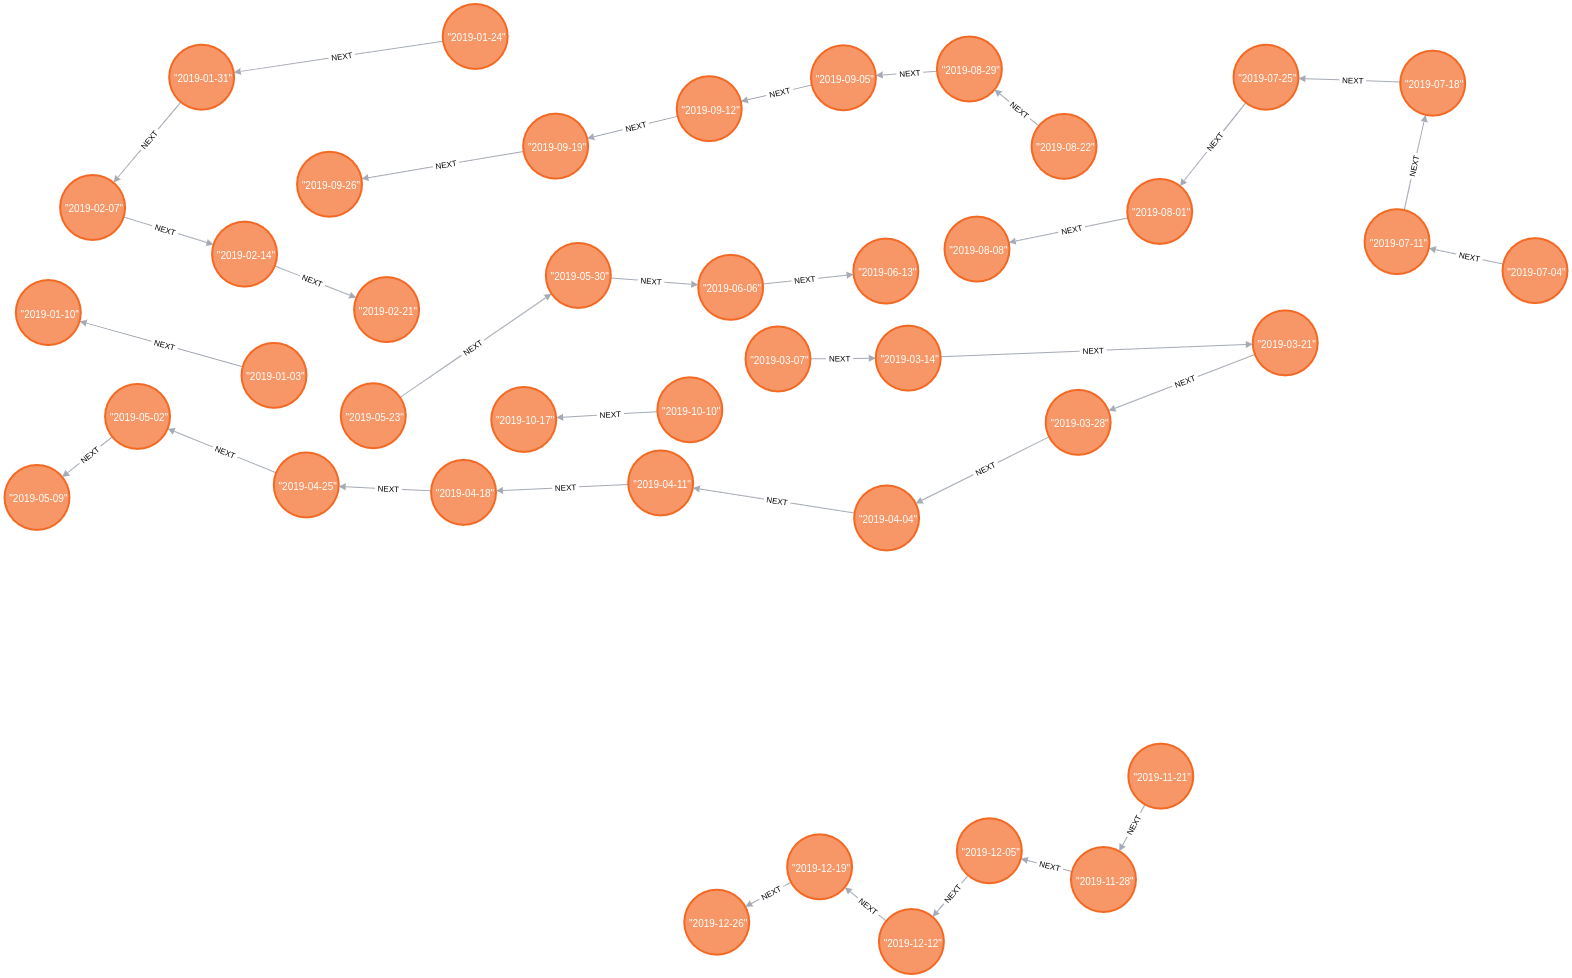
The following query collects all the Chart nodes in order by date and then creates NEXT relationships between consecutive nodes using the apoc.nodes.link procedure:
MATCH (chart:Chart)
WITH chart ORDER BY chart.start
WITH collect(chart) AS charts
CALL apoc.nodes.link(charts, "NEXT")
RETURN count(*)
The Neo4j Browser visualisation below shows the linked list that we’ve now created:
We can now write the following query to return the 5 songs that made the biggest climb in the charts in consecutive weeks:
MATCH (song:Song)-[inChart:IN_CHART]->(chart)<-[:NEXT]-(previousChart),
      (previousChart)<-[inChartPrevious:IN_CHART]-(song),
      (song)-[:ARTIST]->(artist)
WITH song, collect(artist.name) AS artists,
     inChartPrevious.position AS firstPosition,
     inChart.position AS secondPosition,
     previousChart, chart
RETURN song.title AS song, artists, firstPosition, secondPosition,
       firstPosition - secondPosition AS change,
       toString(previousChart.end) AS firstChart,
       toString(chart.end) AS secondChart
ORDER BY change DESC
LIMIT 5| song | artists | firstPosition | secondPosition | change | firstChart | secondChart |
|---|---|---|---|---|---|---|
"Bruises" |
["Lewis Capaldi"] |
82 |
11 |
71 |
"2019-10-03" |
"2019-10-10" |
"Playing Games" |
["Summer Walker", "Bryson Tiller"] |
93 |
25 |
68 |
"2019-10-10" |
"2019-10-17" |
"Girls Like You" |
["Maroon 5", "Cardi B"] |
97 |
34 |
63 |
"2019-01-03" |
"2019-01-10" |
"Lose You To Love Me" |
["Selena Gomez"] |
65 |
3 |
62 |
"2019-10-31" |
"2019-11-07" |
"Play" |
["Years & Years", "Jax Jones"] |
80 |
19 |
61 |
"2019-01-03" |
"2019-01-10" |
There are some big climbers there, but I think it’ll be more interesting to look at number 1 songs in this context.
Which songs went straight in at number 1?
Let’s start by seeing whether any of our number 1 songs went straight in at number 1. The following query will tell us the answer to this question:
// Find songs that charted at position 1
MATCH (song:Song)-[inChart:IN_CHART {position: 1}]->(chart)

// And didn't have an entry on a chart before this one
WHERE not((chart)<-[:NEXT*]-()<-[:IN_CHART]-(song))

WITH song, chart ORDER BY chart.end
RETURN song.title AS song,
       [(song)-[:ARTIST]->(artist) | artist.name] AS artists,
collect(toString(chart.end)) AS chart| song | artists | chart |
|---|---|---|
"Sweet But Psycho" |
["Ava Max"] |
["2019-01-03"] |
"7 Rings" |
["Ariana Grande"] |
["2019-01-31"] |
"Break Up With Your Girlfriend I’M Bored" |
["Ariana Grande"] |
["2019-02-21"] |
"Vossi Bop" |
["Stormzy"] |
["2019-05-09"] |
"I Don’T Care" |
["Ed Sheeran", "Justin Bieber"] |
["2019-05-23"] |
"I Love Sausage Rolls" |
["LadBaby"] |
["2019-12-26"] |
6 songs went straight in at the top. That means we still have 6 songs that came in at a lower position and then climbed to number 1.
Which songs didn’t go straight to number 1?
The following query will help us figure out what position they charted on their first entry:
// Find the first week that the song got to number 1
MATCH (song:Song)-[inChart:IN_CHART {position: 1}]->(chart)
WITH song, chart ORDER BY song, chart.end
WITH song, collect(chart)[0] AS firstWeekAtNumber1

// Find the earliest week that the song charted
MATCH (firstWeekAtNumber1)<-[:NEXT*]-(previous)<-[previousInChart:IN_CHART]-(song)
WITH song, firstWeekAtNumber1, previous, previousInChart
ORDER BY song, previous.end
WITH song, firstWeekAtNumber1,
     collect(previousInChart.position)[0] AS firstPosition,
     collect(previous)[0] AS firstWeek

RETURN song.title AS song,
       [(song)-[:ARTIST]->(artist) | artist.name] AS artists,
       toString(firstWeekAtNumber1.end) AS firstWeekAtNumber1,
       firstPosition AS firstPosition,
       toString(firstWeek.end) AS firstWeek,
[path = (firstWeekAtNumber1)<-[:NEXT*]-(firstWeek) | length(path)][0] AS weeksToReachNumber1| song | artists | firstWeekAtNumber1 | firstPosition | firstWeek | weeksToReachNumber1 |
|---|---|---|---|---|---|
"Someone You Loved" |
["Lewis Capaldi"] |
"2019-03-07" |
66 |
"2019-01-17" |
7 |
"Dance Monkey" |
["Tones and I"] |
"2019-10-10" |
82 |
"2019-08-15" |
8 |
"Take Me Back To London" |
["Ed Sheeran", "Stormzy"] |
"2019-09-05" |
3 |
"2019-07-25" |
6 |
"Senorita" |
["Shawn Mendes", "Camila Cabello"] |
"2019-07-18" |
2 |
"2019-07-04" |
2 |
"Beautiful People" |
["Khalid", "Ed Sheeran"] |
"2019-07-25" |
3 |
"2019-07-11" |
2 |
"Old Town Road" |
["Billy Ray Cyrus", "Lil Nas X"] |
"2019-04-25" |
67 |
"2019-04-04" |
3 |
Interestingly the longest running number 1, Dance Monkey, started at the lowest position. And not only that, it took almost 2 months for it to get up to the number 1 spot. So if you start with a low chart position, all is not lost!
What’s interesting about this QuickGraph?
This post has gone on for much longer than I intended, but I’ll conclude with some thoughts on what makes this QuickGraph interesting.
There’s a lot of analysis of the charts in the UK, but it’s often done along one dimension, be that a song or an artist. By modelling the data as a graph we can easily query the data along multiple dimensions. I especially enjoyed writing the queries that looked at how songs did across multiple charts.
We could certainly extend our analysis further by adding in Wiki data, as Jesús Barrasa did in his QuickGraph #10, but that can wait for another blog post!
About the author
I'm currently working on short form content at ClickHouse. I publish short 5 minute videos showing how to solve data problems on YouTube @LearnDataWithMark. I previously worked on graph analytics at Neo4j, where I also co-authored the O'Reilly Graph Algorithms Book with Amy Hodler.