
Python: Pandas - DataFrame plotting ignoring figure
In my continued use of matplotlib I wanted to change the size of the chart I was plotting and struggled a bit to start with. We’ll use the same DataFrame as before:
df = pd.DataFrame({
    "name": ["Mark", "Arya", "Praveena"],
    "age": [34, 1, 31]
})
df
In my last blog post I showed how we can create a bar chart by executing the following code:
df.plot.bar(x="name")
plt.tight_layout()
plt.show()
plt.close()I gave this a try:
plt.figure(figsize=(20,10))
df.plot.bar(x="name")
plt.tight_layout()
plt.show()
plt.close()
If we run that we’ll see this output:
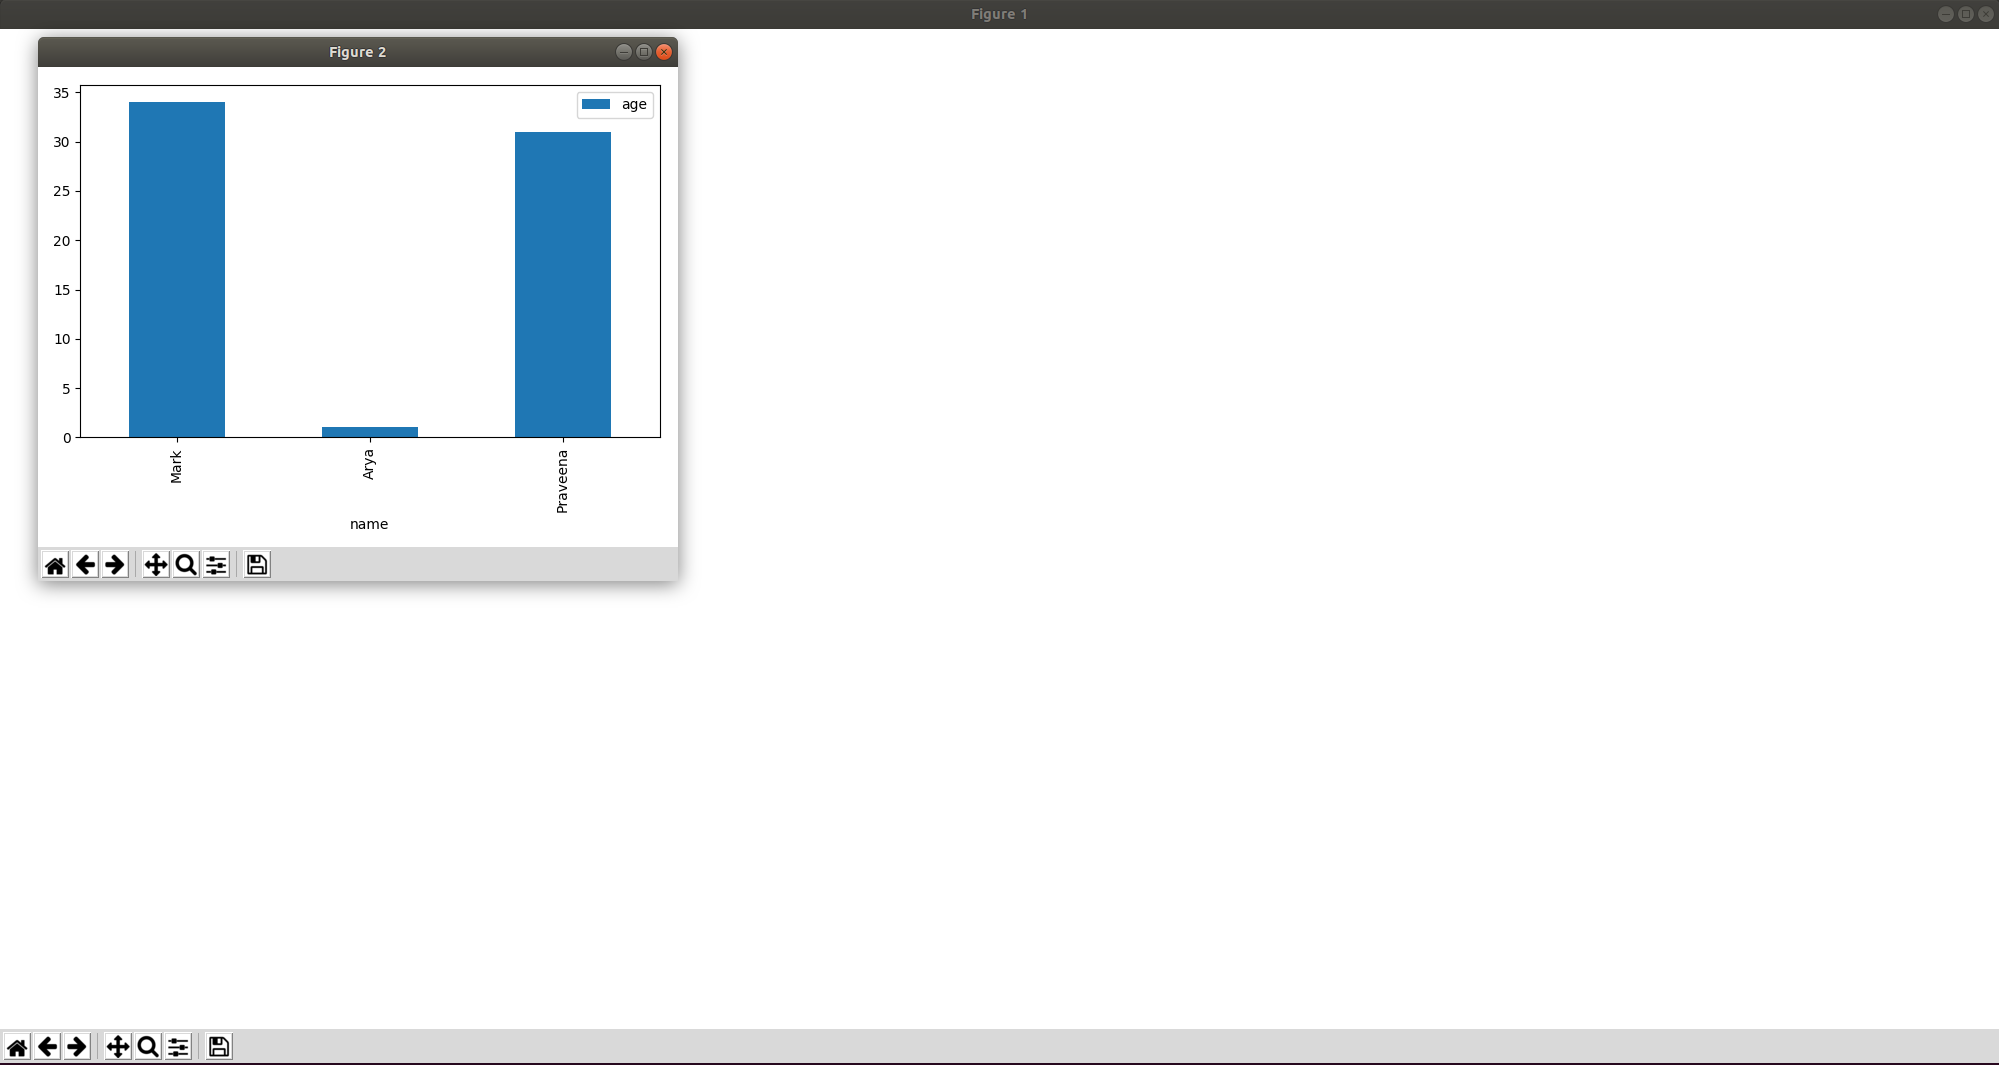
Hmmmm…we now have two figures, and the bigger one is completely blank! That’s not quite what we expected.
I came across a really thorough StackOverflow post which explained a variety of ways to solve the problem.
The first way is to specify the figsize parameter when we call the bar function:
df.plot.bar(x="name", figsize=(20,10))
plt.tight_layout()
plt.show()
plt.close()
If we execute that code we’ll now have our big chart:

There are another couple of ways we can achieve this as well.
The plot function takes in a ax parameter, to which we can pass an existing Axes.
The gca function on our plot returns the current Axes instance or creates a new one:
plt.figure(figsize=(20,10))
df.plot.bar(x="name", ax=plt.gca())
plt.tight_layout()
plt.show()
plt.close()
Or rather than using the gca function on plt, we can capture the axes from the figure function and pass it in directly:
fig = plt.figure(figsize=(20,10))
df.plot.bar(x="name", ax=fig.gca())
plt.tight_layout()
plt.show()
plt.close()About the author
I'm currently working on short form content at ClickHouse. I publish short 5 minute videos showing how to solve data problems on YouTube @LearnDataWithMark. I previously worked on graph analytics at Neo4j, where I also co-authored the O'Reilly Graph Algorithms Book with Amy Hodler.