
R: Filling in missing dates with 0s
I wanted to plot a chart showing the number of blog posts published by month and started with the following code which makes use of zoo’s 'as.yearmon' function to add the appropriate column and grouping:
> library(zoo)
> library(dplyr)
> df %>% sample_n(5)
                                                  title                date
888        R: Converting a named vector to a data frame 2014-10-31 23:47:26
144  Rails: Populating a dropdown list using 'form_for' 2010-08-31 01:22:14
615                    Onboarding: Sketch the landscape 2013-02-15 07:36:06
28                        Javascript: The 'new' keyword 2010-03-06 15:16:02
1290                Coding Dojo #16: Reading SUnit code 2009-05-28 23:23:19

> posts_by_date  = df %>% mutate(year_mon = as.Date(as.yearmon(date))) %>% count(year_mon)
> posts_by_date %>% head(5)

    year_mon  n
1 2006-08-01  1
2 2006-09-01  4
3 2008-02-01  4
4 2008-07-01  2
5 2008-08-01 38
I then plugged the new data frame into ggplot to get the chart:
> ggplot(aes(x = year_mon, y = n), data = posts_by_date) + geom_line()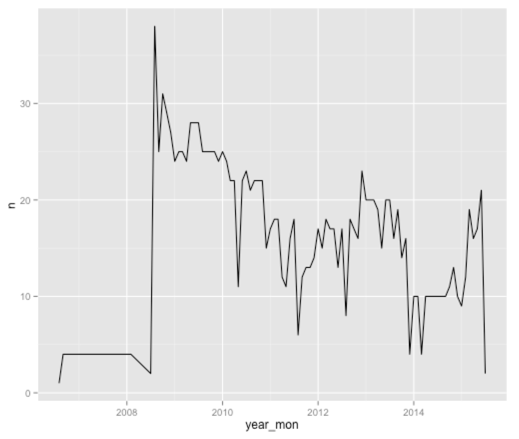
The problem with this chart is that it’s showing there being 4 posts per month for all the dates between September 2006 and February 2008 even though I didn’t write anything! It’s doing the same thing between February 2008 and July 2008 too.
We can fix that by filling in the gaps with 0s.
First we’ll create a vector containing every month in the data range contained by our data frame:
> all_dates = seq(as.Date(as.yearmon(min(df$date))), as.Date(as.yearmon(max(df$date))), by="month")

> all_dates
  [1] "2006-08-01" "2006-09-01" "2006-10-01" "2006-11-01" "2006-12-01" "2007-01-01" "2007-02-01" "2007-03-01"
  [9] "2007-04-01" "2007-05-01" "2007-06-01" "2007-07-01" "2007-08-01" "2007-09-01" "2007-10-01" "2007-11-01"
 [17] "2007-12-01" "2008-01-01" "2008-02-01" "2008-03-01" "2008-04-01" "2008-05-01" "2008-06-01" "2008-07-01"
 [25] "2008-08-01" "2008-09-01" "2008-10-01" "2008-11-01" "2008-12-01" "2009-01-01" "2009-02-01" "2009-03-01"
 [33] "2009-04-01" "2009-05-01" "2009-06-01" "2009-07-01" "2009-08-01" "2009-09-01" "2009-10-01" "2009-11-01"
 [41] "2009-12-01" "2010-01-01" "2010-02-01" "2010-03-01" "2010-04-01" "2010-05-01" "2010-06-01" "2010-07-01"
 [49] "2010-08-01" "2010-09-01" "2010-10-01" "2010-11-01" "2010-12-01" "2011-01-01" "2011-02-01" "2011-03-01"
 [57] "2011-04-01" "2011-05-01" "2011-06-01" "2011-07-01" "2011-08-01" "2011-09-01" "2011-10-01" "2011-11-01"
 [65] "2011-12-01" "2012-01-01" "2012-02-01" "2012-03-01" "2012-04-01" "2012-05-01" "2012-06-01" "2012-07-01"
 [73] "2012-08-01" "2012-09-01" "2012-10-01" "2012-11-01" "2012-12-01" "2013-01-01" "2013-02-01" "2013-03-01"
 [81] "2013-04-01" "2013-05-01" "2013-06-01" "2013-07-01" "2013-08-01" "2013-09-01" "2013-10-01" "2013-11-01"
 [89] "2013-12-01" "2014-01-01" "2014-02-01" "2014-03-01" "2014-04-01" "2014-05-01" "2014-06-01" "2014-07-01"
 [97] "2014-08-01" "2014-09-01" "2014-10-01" "2014-11-01" "2014-12-01" "2015-01-01" "2015-02-01" "2015-03-01"
[105] "2015-04-01" "2015-05-01" "2015-06-01" "2015-07-01"
Now we need to create a data frame containing those dates and merge it with the original:
posts_by_date_clean = merge(data.frame(date = all_dates),
                            posts_by_date,
                            by.x='date',
                            by.y='year_mon',
                            all.x=T,
                            all.y=T)

> posts_by_date_clean %>% head()
        date  n
1 2006-08-01  1
2 2006-09-01  4
3 2006-10-01 NA
4 2006-11-01 NA
5 2006-12-01 NA
6 2007-01-01 NA
We’ve still got some 'NA' values in there which won’t plot so well. Let’s set those to 0 and then try and plot our chart again:
> posts_by_date_clean$n[is.na(posts_by_date_clean$n)] = 0
> ggplot(aes(x = date, y = n), data = posts_by_date_clean) + geom_line()
Much better!
About the author
I'm currently working on short form content at ClickHouse. I publish short 5 minute videos showing how to solve data problems on YouTube @LearnDataWithMark. I previously worked on graph analytics at Neo4j, where I also co-authored the O'Reilly Graph Algorithms Book with Amy Hodler.