
R: dplyr - Error: cannot modify grouping variable
I’ve been doing some exploration of the posts made on this blog and I thought I’d start with answering a simple question - on which dates did I write the most posts?
I started with a data frame containing each post and the date it was published:
> library(dplyr)
> df %>% sample_n(5)
                                                title                date
1148 Taiichi Ohno's Workplace Management: Book Review 2008-12-08 14:14:48
158     Rails: Faking a delete method with 'form_for' 2010-09-20 18:52:15
331           Retrospectives: The 4 L's Retrospective 2011-07-25 21:00:30
1035       msbuild - Use OutputPath instead of OutDir 2008-08-14 18:54:03
1181                The danger of commenting out code 2009-01-17 06:02:33
To find the most popular days for blog posts we can write the following aggregation function:
> df %>% mutate(day = as.Date(date)) %>% count(day) %>% arrange(desc(n))

Source: local data frame [1,140 x 2]

          day n
1  2012-12-31 6
2  2014-05-31 6
3  2008-08-08 5
4  2013-01-27 5
5  2009-08-24 4
6  2012-06-24 4
7  2012-09-30 4
8  2012-10-27 4
9  2012-11-24 4
10 2013-02-28 4
So we can see a couple of days with 6 posts, a couple with 5 posts, a few more with 4 posts and then presumably loads of days with 1 post.
I thought it’d be cool if we could blog a histogram which had on the x axis the number of posts and on the y axis how many days that number of posts occurred e.g. for an x value of 6 (posts) we’d have a y value of 2 (occurrences).
My initial attempt was this:
> df %>% mutate(day = as.Date(date)) %>% count(day) %>% count(n)
Error: cannot modify grouping variable
Unfortunately that isn’t allowed. I tried ungrouping and then counting again:
 df %>% mutate(day = as.Date(date)) %>% count(day) %>% ungroup() %>% count(n)
Error: cannot modify grouping variable
Still no luck. I did a bit of googlign around and came across a post which suggested using a combination of group_by + mutate or group_by + summarize.
I tried the mutate approach first:
> df %>% mutate(day = as.Date(date)) %>%
+     group_by(day) %>% mutate(n = n()) %>% ungroup() %>% sample_n(5)
                                                        title                Source: local data frame [5 x 4]

                                    title                date        day n
1 QCon London 2009: DDD & BDD - Dan North 2009-03-13 15:28:04 2009-03-13 2
2        Onboarding: Sketch the landscape 2013-02-15 07:36:06 2013-02-15 1
3                           Ego Depletion 2013-06-04 23:16:29 2013-06-04 1
4                 Clean Code: Book Review 2008-09-15 09:52:33 2008-09-15 1
5            Dreyfus Model: More thoughts 2009-08-10 10:36:51 2009-08-10 1
That keeps around the 'title' which is a bit annoying. We can get rid of it using a distinct on 'day' if we want and if we also implement the second part of the function we end up with the following:
> df %>% mutate(day = as.Date(date)) %>%
    group_by(day) %>% mutate(n = n()) %>% distinct(day) %>% ungroup() %>%
    group_by(n) %>%
    mutate(c = n()) %>%
    distinct(n)

Source: local data frame [6 x 5]
Groups: n

                                                title                date        day n   c
1       Functional C#: Writing a 'partition' function 2010-02-01 23:34:02 2010-02-01 1 852
2                            Willed vs Forced designs 2010-02-08 22:48:05 2010-02-08 2 235
3                            TDD: Testing collections 2010-07-28 06:05:25 2010-07-28 3  41
4  Creating a Samba share between Ubuntu and Mac OS X 2012-06-24 00:40:35 2012-06-24 4   8
5            Gamification and Software: Some thoughts 2012-12-31 10:57:19 2012-12-31 6   2
6 Python/numpy: Selecting specific column in 2D array 2013-01-27 02:10:10 2013-01-27 5   2
Annoyingly we’ve still got the 'title', 'date' and 'day' columns hanging around which we’d need to get rid of with a call to 'select'. The code also feels quite icky, especially the use of distinct in a couple of places.
In fact we can simplify the code if we use summarize instead of mutate:
> df %>% mutate(day = as.Date(date)) %>%
    group_by(day) %>% summarize(n = n()) %>% ungroup() %>%
    group_by(n) %>% summarize(c = n())


Source: local data frame [6 x 2]

  n   c
1 1 852
2 2 235
3 3  41
4 4   8
5 5   2
6 6   2
And we’ve got also rid of the extra columns in the bargain which is great! And now we can plot our histogram:
> library(ggplot2)
> post_frequencies = df %>% mutate(day = as.Date(date)) %>%
    group_by(day) %>% summarize(n = n()) %>% ungroup() %>%
    group_by(n) %>% summarize(c = n())
> ggplot(aes(x = n, y = c), data = post_frequencies) + geom_bar(stat = "identity")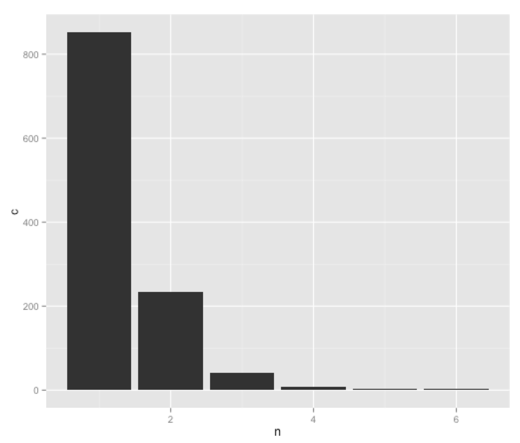
In this case we don’t actually need to do the second grouping to create the bar chart since ggplot will do it for us if we feed it the following data:
. ggplot(aes(x = n),
         data = df %>% mutate(day = as.Date(date)) %>% group_by(day) %>% summarize(n = n()) %>% ungroup()) +
    geom_bar(binwidth = 1) +
    scale_x_continuous(limits=c(1, 6))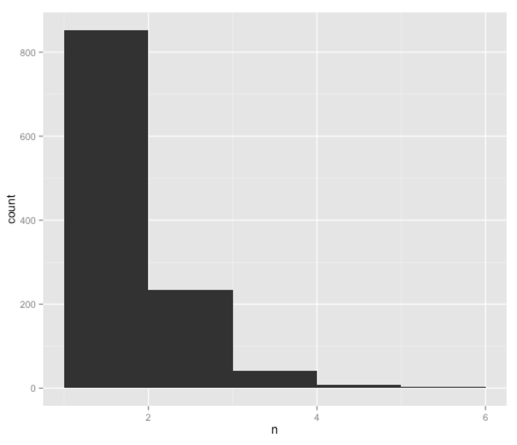
Still, it’s good to know how!
About the author
I'm currently working on short form content at ClickHouse. I publish short 5 minute videos showing how to solve data problems on YouTube @LearnDataWithMark. I previously worked on graph analytics at Neo4j, where I also co-authored the O'Reilly Graph Algorithms Book with Amy Hodler.