
Leaflet: Fit polyline in view
I’ve been playing with the Leaflet.js library over the Christmas holidays to visualise running routes drawn onto the map using a Polyline and I wanted to zoom the map the right amount to see all the points.
Pre requisites
We have the following HTML to define the div that will contain the map.
<div id="container">
<div id="map" style="width: 100%; height: 100%">
</div>
</div>We also need to import the following Javascript and CSS files:
<script src="http://cdn.leafletjs.com/leaflet-0.7/leaflet.js"></script>
<script type="text/javascript" src="https://rawgit.com/jieter/Leaflet.encoded/master/Polyline.encoded.js"></script>
<link rel="stylesheet" href="http://cdn.leafletjs.com/leaflet-0.7/leaflet.css"/>
<link rel="stylesheet" href="https://cdnjs.cloudflare.com/ajax/libs/leaflet.draw/0.4.2/leaflet.draw.css"/>
<script src="https://cdnjs.cloudflare.com/ajax/libs/leaflet.draw/0.4.2/leaflet.draw.js"></script>Polyline representing part of a route
The following code creates a polyline for a Strava segment that I often run.
var map = L.map('map');
L.tileLayer('http://{s}.tile.openstreetmap.org/{z}/{x}/{y}.png', {maxZoom: 18,}).addTo(map);
var rawPoints = [
{ "latitude": 51.357874010145395, "longitude": -0.198045110923591 },
{ "latitude": 51.3573858289394, "longitude": -0.19787754933584795 },
{ "latitude": 51.35632791810057, "longitude": -0.19750254941422557 },
{ "latitude": 51.35553240304241, "longitude": -0.197232163894512 },
{ "latitude": 51.35496267279901, "longitude": -0.1970247338143316 },
{ "latitude": 51.35388700570004, "longitude": -0.19666483094752069 },
{ "latitude": 51.3533898352570, "longitude": -0.1964976504847828 },
{ "latitude": 51.35358452733139, "longitude": -0.19512563906602554 },
{ "latitude": 51.354762877995036, "longitude": -0.1945622934585907 },
{ "latitude": 51.355610110109986, "longitude": -0.19468697186046677 },
{ "latitude": 51.35680377680643, "longitude": -0.19395063336295112 },
{ "latitude": 51.356861596801075, "longitude": -0.1936180154828497 },
{ "latitude": 51.358487396611125, "longitude": -0.19349660642888197 }
];
var coordinates = rawPoints.map(rawPoint => new L.LatLng(rawPoint["latitude"], rawPoint["longitude"]))
let polyline = L.polyline(
coordinates,
{
color: 'blue',
weight: 3,
opacity: .7,
lineJoin: 'round'
}
);
polyline.addTo(map);I wanted to centre the map around the polyline and initially wrote the following code to do this:
let lats = rawPoints.map(c => c.latitude).reduce((previous, current) => current += previous, 0.0);
let longs = rawPoints.map(c => c.longitude).reduce((previous, current) => current += previous, 0.0);
const position = [lats / rawPoints.length, longs / rawPoints.length];
map.setView(position, 17);This works fine but the zoom factor was wrong when I drew longer polylines so I needed a better solution.
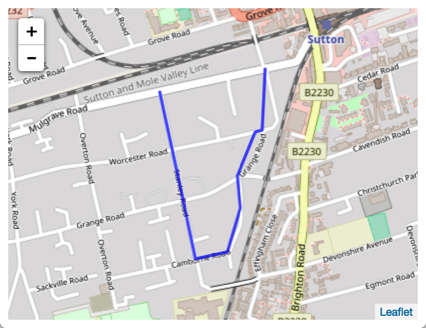
I should have RTFM because there’s a much simpler way to do this. I actually found the explanation in a GitHub issue from 2011! We can replace the previous snippet with this single line of code:
map.fitBounds(polyline.getBounds());And this is how it looks on the screen:
About the author
I'm currently working on short form content at ClickHouse. I publish short 5 minute videos showing how to solve data problems on YouTube @LearnDataWithMark. I previously worked on graph analytics at Neo4j, where I also co-authored the O'Reilly Graph Algorithms Book with Amy Hodler.