
R: Date for given week/year
As I mentioned in my last couple of blog posts I’ve been looking at the data behind this blog and I wanted to plot a chart showing the number of posts per week since the blog started.
I started out with a data frame with posts and publication date:
> library(dplyr)
> df = read.csv("posts.csv")
> df$date = ymd_hms(df$date)
> df %>% sample_n(10)
title date
538 Nygard Big Data Model: The Investigation Stage 2012-10-10 00:00:36
341 The read-only database 2011-08-29 23:32:26
1112 CSS in Internet Explorer - Some lessons learned 2008-10-31 15:24:51
143 Coding: Mutating parameters 2010-08-26 07:47:23
433 Scala: Counting number of inversions (via merge sort) for an unsorted collection 2012-03-20 06:53:18
618 neo4j/cypher: SQL style GROUP BY functionality 2013-02-17 21:05:27
1111 Testing Hibernate mappings: Setting up test data 2008-10-30 13:24:14
462 neo4j: What question do you want to answer? 2012-05-05 13:20:41
1399 Book Club: Design Sense (Michael Feathers) 2009-09-29 14:42:29
494 Bash Shell: Reusing parts of previous commands 2012-07-05 23:42:35The first step was to add a couple of columns representing the week and year for the publication date. The 'lubridate' library came in handy here:
byWeek = df %>%
mutate(year = year(date), week = week(date)) %>%
group_by(week, year) %>% summarise(n = n()) %>%
ungroup() %>% arrange(desc(n))
> byWeek
Source: local data frame [352 x 3]
week year n
1 33 2008 14
2 35 2008 11
3 53 2012 11
4 9 2013 10
5 12 2013 9
6 21 2009 9
7 22 2009 9
8 38 2013 9
9 40 2008 9
10 48 2012 9
.. ... ... ..The next step is to calculate the start date of each of those weeks so that we can plot the counts on a continuous date scale. I spent a while searching how to do this before realising that the 'week' function I used before can set the week for a given data as well. Let’s get to work:
calculate_start_of_week = function(week, year) {
date <- ymd(paste(year, 1, 1, sep="-"))
week(date) = week
return(date)
}
> calculate_start_of_week(c(1,2,3), c(2015,2014,2013))
[1] "2015-01-01 UTC" "2014-01-08 UTC" "2013-01-15 UTC"And now let’s transform our data frame and plot the counts:
ggplot(aes(x=start_of_week, y=n, group=1),
data = byWeek %>% mutate(start_of_week = calculate_start_of_week(week, year))) +
geom_line()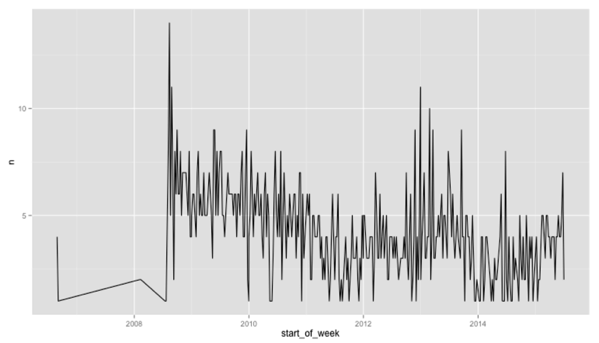
It’s a bit erratic as you can see. Some of this can be explained by the fact that I do in fact post in an erratic way while some of it is explained by the fact that some weeks only have a few days if they start on the 29th onwards.
About the author
I'm currently working on short form content at ClickHouse. I publish short 5 minute videos showing how to solve data problems on YouTube @LearnDataWithMark. I previously worked on graph analytics at Neo4j, where I also co-authored the O'Reilly Graph Algorithms Book with Amy Hodler.