
Kaggle Titanic: Python pandas attempt
Nathan and I have been looking at Kaggle’s Titanic problem and while working through the Python tutorial Nathan pointed out that we could greatly simplify the code if we used pandas instead.
The problem we had with numpy is that you use integers to reference columns. We spent a lot of time being thoroughly confused as to why something wasn’t working only to realise we were using the wrong column.
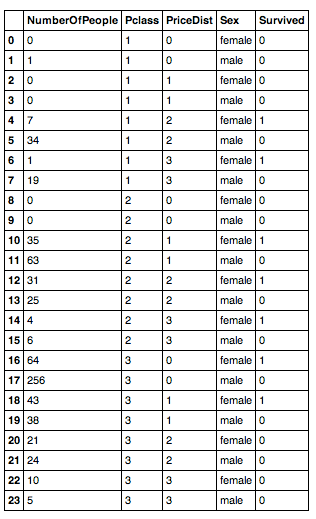
The algorithm scores an accuracy of 77.99% and the way it works is that we build a 'survival table' which works out an average survival rate of people based on 3 features:
-
Passenger Class
-
Passenger Fare (grouped into those who paid 0-9, 10-19, 20-29, 30+)
-
Gender
It looks like this:
And the code that creates that is:
import pandas as pd

def addrow(df, row):
    return df.append(pd.DataFrame(row), ignore_index=True)

def fare_in_bucket(fare, fare_bracket_size, bucket):
    return (fare > bucket * fare_bracket_size) & (fare <= ((bucket+1) * fare_bracket_size))

def build_survival_table(training_file):
    fare_ceiling = 40
    train_df = pd.read_csv(training_file)
    train_df[train_df['Fare'] >= 39.0] = 39.0
    fare_bracket_size = 10
    number_of_price_brackets = fare_ceiling / fare_bracket_size
    number_of_classes = 3 #There were 1st, 2nd and 3rd classes on board

    survival_table = pd.DataFrame(columns=['Sex', 'Pclass', 'PriceDist', 'Survived', 'NumberOfPeople'])

    for pclass in range(1, number_of_classes + 1): # add 1 to handle 0 start
        for bucket in range(0, number_of_price_brackets):
            for sex in ['female', 'male']:
                survival = train_df[(train_df['Sex'] == sex)
                                    & (train_df['Pclass'] == pclass)
                                    & fare_in_bucket(train_df["Fare"], fare_bracket_size, bucket)]

                row = [dict(Pclass=pclass, Sex=sex, PriceDist = bucket,
                            Survived = round(survival['Survived'].mean()),
                            NumberOfPeople = survival.count()[0]) ]
                survival_table = addrow(survival_table, row)

    return survival_table.fillna(0)

survival_table = build_survival_table("train.csv")
where 'train.csv' is structured like so:
$ head -n5 train.csv
PassengerId,Survived,Pclass,Name,Sex,Age,SibSp,Parch,Ticket,Fare,Cabin,Embarked
1,0,3,"Braund, Mr. Owen Harris",male,22,1,0,A/5 21171,7.25,,S
2,1,1,"Cumings, Mrs. John Bradley (Florence Briggs Thayer)",female,38,1,0,PC 17599,71.2833,C85,C
3,1,3,"Heikkinen, Miss. Laina",female,26,0,0,STON/O2. 3101282,7.925,,S
4,1,1,"Futrelle, Mrs. Jacques Heath (Lily May Peel)",female,35,1,0,113803,53.1,C123,S
After we’ve built that we iterate through the test data set and look up each person in the table and find their survival rate.
def select_bucket(fare):
    if (fare >= 0 and fare < 10):
        return 0
    elif (fare >= 10 and fare < 20):
        return 1
    elif (fare >= 20 and fare < 30):
        return 2
    else:
        return 3

def calculate_survival(survival_table, row):
    survival_row = survival_table[(survival_table["Sex"] == row["Sex"]) & (survival_table["Pclass"] == row["Pclass"]) & (survival_table["PriceDist"] == select_bucket(row["Fare"]))]
    return int(survival_row["Survived"].iat[0])

test_df = pd.read_csv('test.csv')
test_df["Survived"] = test_df.apply(lambda row: calculate_survival(survival_table, row), axis=1)
I wrote up the difficulties we had working out how to append the 'Survived' column if you want more detail.
'test.csv' looks like this:
$ head -n5 test.csv
PassengerId,Pclass,Name,Sex,Age,SibSp,Parch,Ticket,Fare,Cabin,Embarked
892,3,"Kelly, Mr. James",male,34.5,0,0,330911,7.8292,,Q
893,3,"Wilkes, Mrs. James (Ellen Needs)",female,47,1,0,363272,7,,S
894,2,"Myles, Mr. Thomas Francis",male,62,0,0,240276,9.6875,,Q
895,3,"Wirz, Mr. Albert",male,27,0,0,315154,8.6625,,S
We then write out the survival value for each customer along with their ID:
test_df.to_csv("result.csv", cols=['PassengerId', 'Survived'], index=False)$ head -n5 result.csv
PassengerId,Survived
892,0
893,1
894,0
895,0I’ve pasted the code as a gist for those who want to see it all as one.
Next step: introduce some real machine learning, probably using scikit-learn unless there’s something else we should be using?
About the author
I'm currently working on short form content at ClickHouse. I publish short 5 minute videos showing how to solve data problems on YouTube @LearnDataWithMark. I previously worked on graph analytics at Neo4j, where I also co-authored the O'Reilly Graph Algorithms Book with Amy Hodler.