Mikado-ish method for debugging
I’ve written previously about the Mikado method and how I’ve made use of it for identifying ways in which I could refactor code but I think this approach is more generally applicable for any kind of code investigation.
Our application has a lot of calculations in it and we’ve been trying to refactor the code which wires all the calculators up to make use of a DSL which reveals the intention of the code more as well as making it easier to test.
Unfortunately after changing the code to use this approach one of the calculations was about by about £15.00 in one of our acceptance tests.
We didn’t have the best logging around all the calculators so it wasn’t immediately obvious where to start looking for the problem.
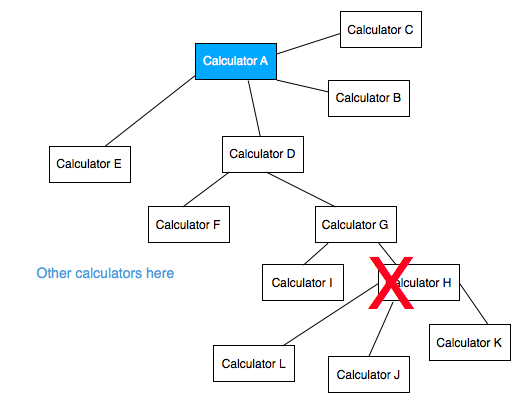
I decided to sketch out the ways the calculators interacted with each other and then follow the deepest path - which was Calculator D - Calculator G - Calculator H - to see if there were any differences in the values being calculated when running the old and new versions of the code.

Interestingly there was no problem in that bit of the code which then allowed me to rule out that whole part of the tree and then start looking at the other calculators to try and find the problem.
I’d previously been trying to work out what was going on just by reading through the code but found it incredibly difficult to remember where I’d already investigated so drawing the diagram really helped with that too.
About the author
I'm currently working on short form content at ClickHouse. I publish short 5 minute videos showing how to solve data problems on YouTube @LearnDataWithMark. I previously worked on graph analytics at Neo4j, where I also co-authored the O'Reilly Graph Algorithms Book with Amy Hodler.
